Analysis
Automated Image Analysis
From its inception, OME was designed to support automated image analysis. The use of analytic software to extract information from images is an area of ongoing research. In many cases, these analyses feed upon each other - the output of one becomes the input of the next. Construction of useful sequences of analyses may be an important outcome of work with OME. Thus, as you might expect, the OME database contains a rich body of information about analysis programs and their utilization.
OME defines an entity called an analysis module which encodes this information. An analysis module represents any process which can create attributes. The act of creating new data is encoded as a transformation which generates or distills new information from existing data. This is represented by a module's formal inputs and formal outputs; a module receives input attributes for each of its formal inputs, performs its transformation or computation, and generates new output attributes for each of its formal outputs. Each formal input and output is semantically typed, which places a constraint on which attributes will be accepted as inputs or creates as outputs.
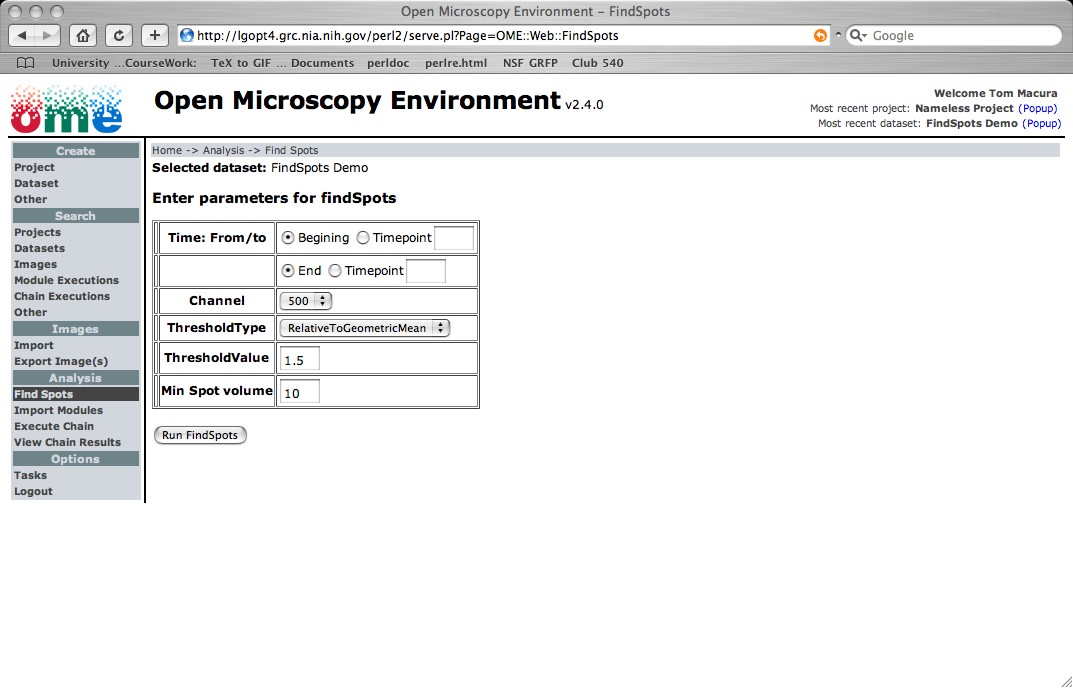
OME allows users, after they write the appropriate XML wrapper, to execute arbitrary MATLAB functions as analysis chains. You can use the web ui to import, execute (Figure 7-a), and then view (Figure 7-b & 7-c) the outputs of your analysis modules. For additional details read the developer pages link.
The web ui provides a generic tabular interface (Figure 7-b) for displaying the output of analysis modules run in the OME. Module results can be exported as tab-delimited text for use with other stand-alone programs (e.g. Excel).

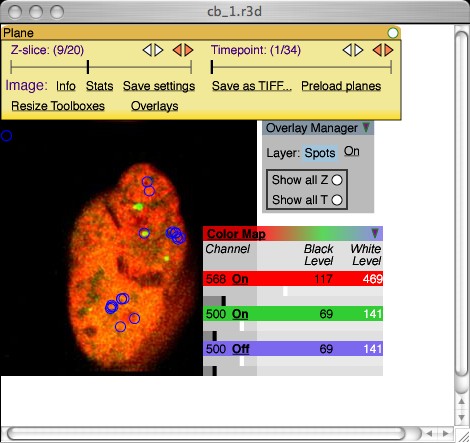
The web ui uses semantic type specific html templates. This makes it very extensible. For the FindSpots analysis chain, the SVG image viewer was modified to display found spots as overlays.