Personal tools

|
Exporting Figures from OMERO.insight
A new feature in OMERO 4.2 is the ability to export images as figures, based on their annotations, metadata, ROIs etc. All figures are saved as attachments to the appropriate Project, Dataset or Image, and are also available to download. A figure legend is generated for each figure (downloaded as text file) which contains additional details for each image, such as name, ID, scale bar size, rendering settings, projected planes, pixel size, etc. These figures are based on examples detailed below. See the demo movie here. 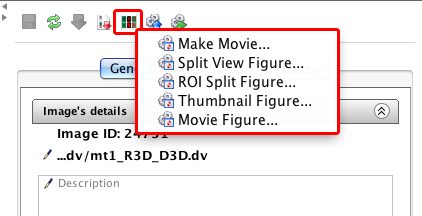
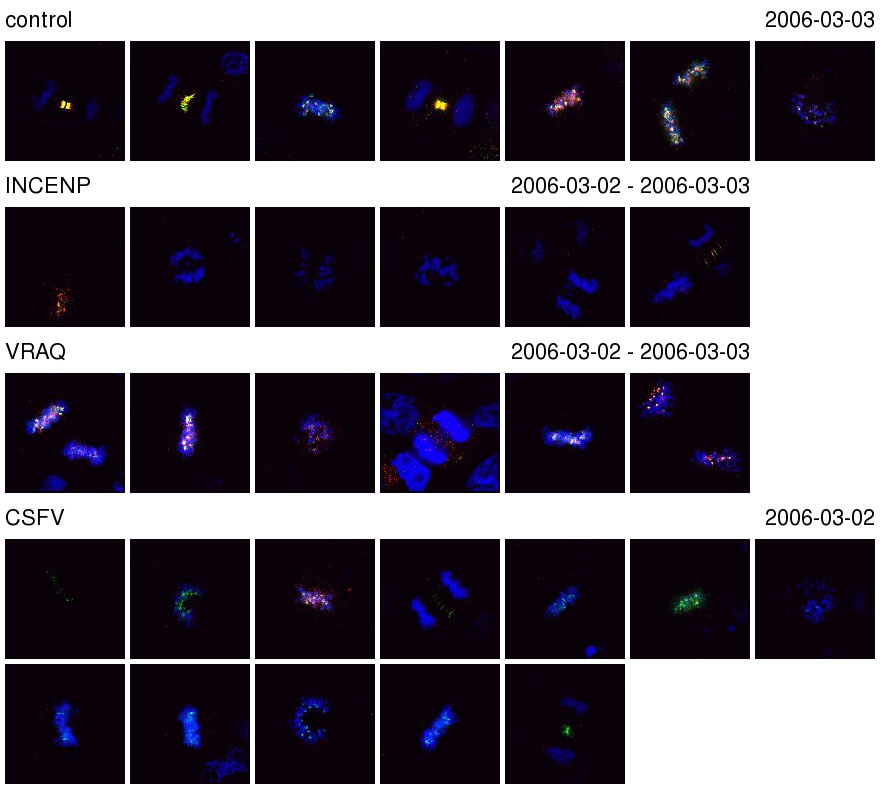
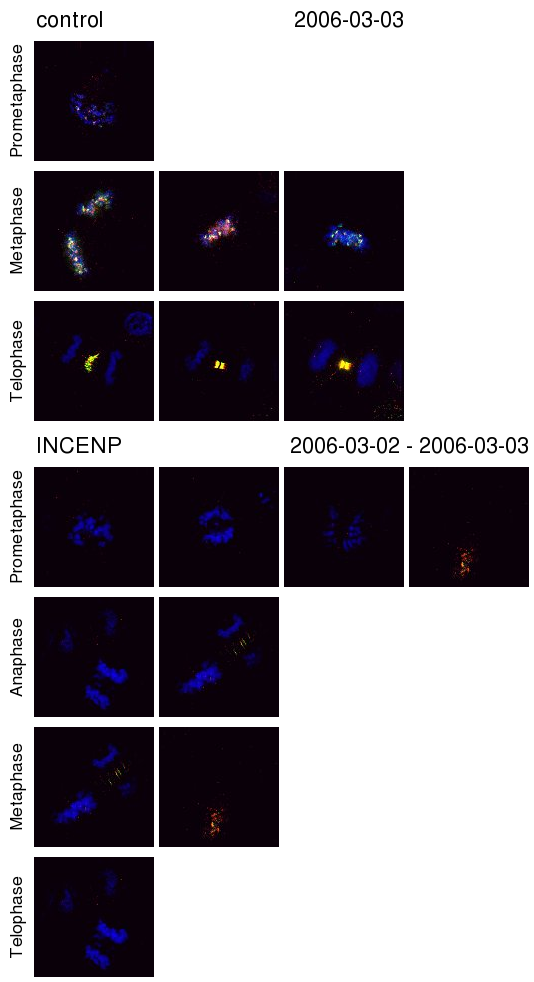
All figure generating options are available from the top-right toolbar in Insight and will try to use the currently selected images or datasets in the chosen figure (see screen-shot). Thumbnail FigureThis creates a figure of thumbnails, either using the currently selected images or all the images within a dataset. The date range of the images is displayed on the figure, and it is also possible to choose a list of tags to sort the images by. If an image is tagged by multiple tags, it will appear more than once in the figure.
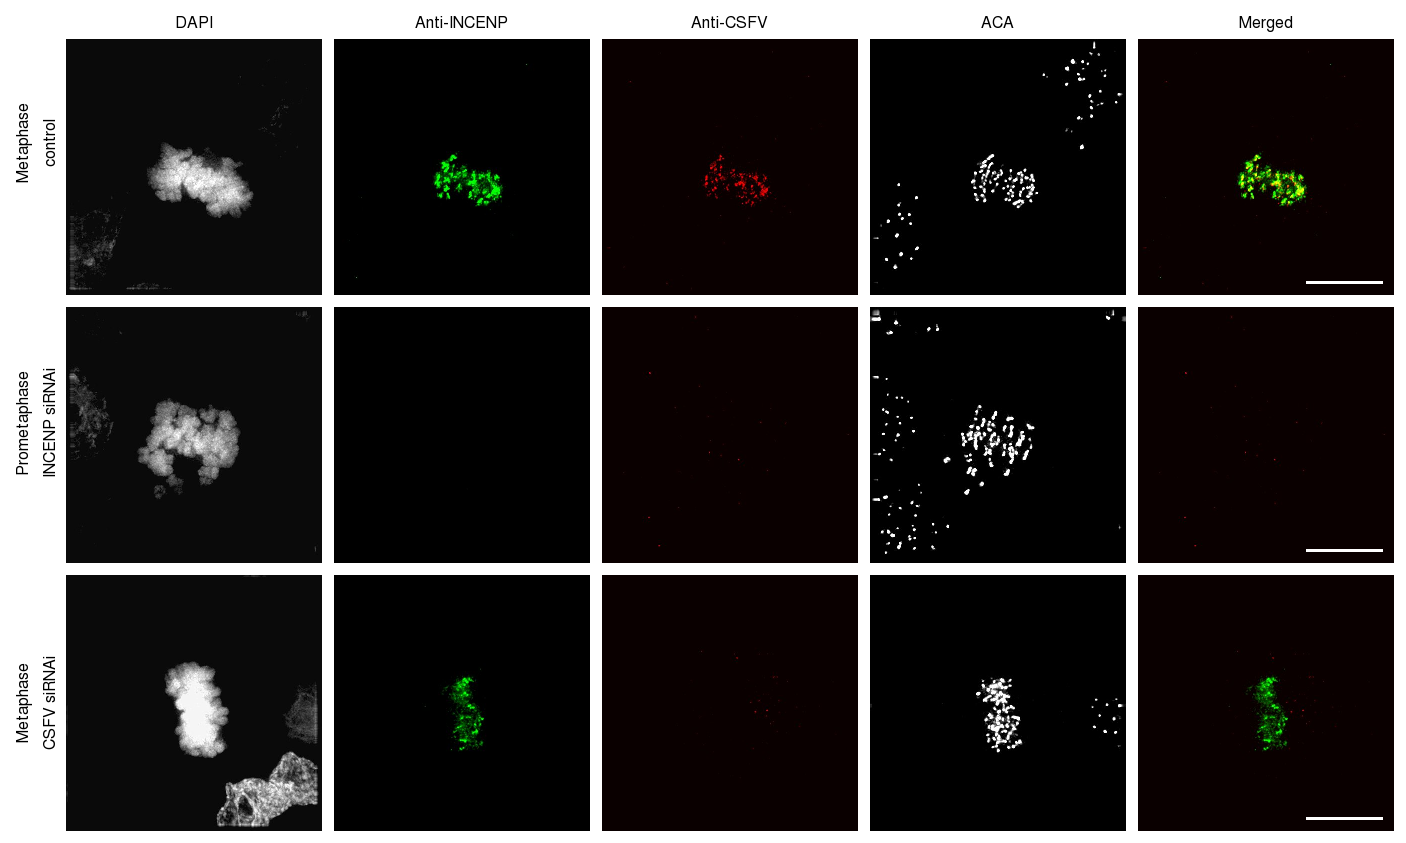
Split-view FigureChoose one or more images to be arranged in a split-view with one image per row. When making the image you can decide which channels should be shown as split panes and which are in the merged image. You can also choose names for each channel (or use existing names) and choose whether you want the split channels to be coloured or greyscale. Images can be labeled with their name, the name of their dataset(s) or associated tags.
Split-View Figure of 3 images with 4 channels, showing 2 channels in the merged panel. Images are labeled with their Tags. This figure displays selected frames from one or more movies, laid out on a single row. If timing metadata is available, the time of each frame is displayed. Images can be labeled with their name, the name of their dataset(s) or associated tags. 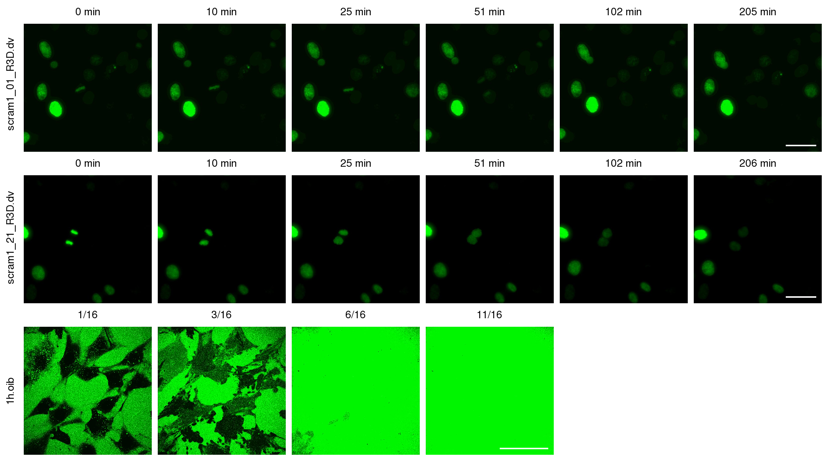
Movie figure showing 3 images, labeled with image name. The 3rd movie does not have timing metadata (frame numbers shown instead), and has fewer frames than the top 2 movies. ROI FigureIf a rectangle ROI has previously been defined for an image (or images), then this figure will display the ROI as a larger panel to the right of the main image, zoomed by a chosen factor. The zoomed ROI will be split into selected channels, as for the split-view figure. Images can be labeled with their name, the name of their dataset(s) or associated tags. 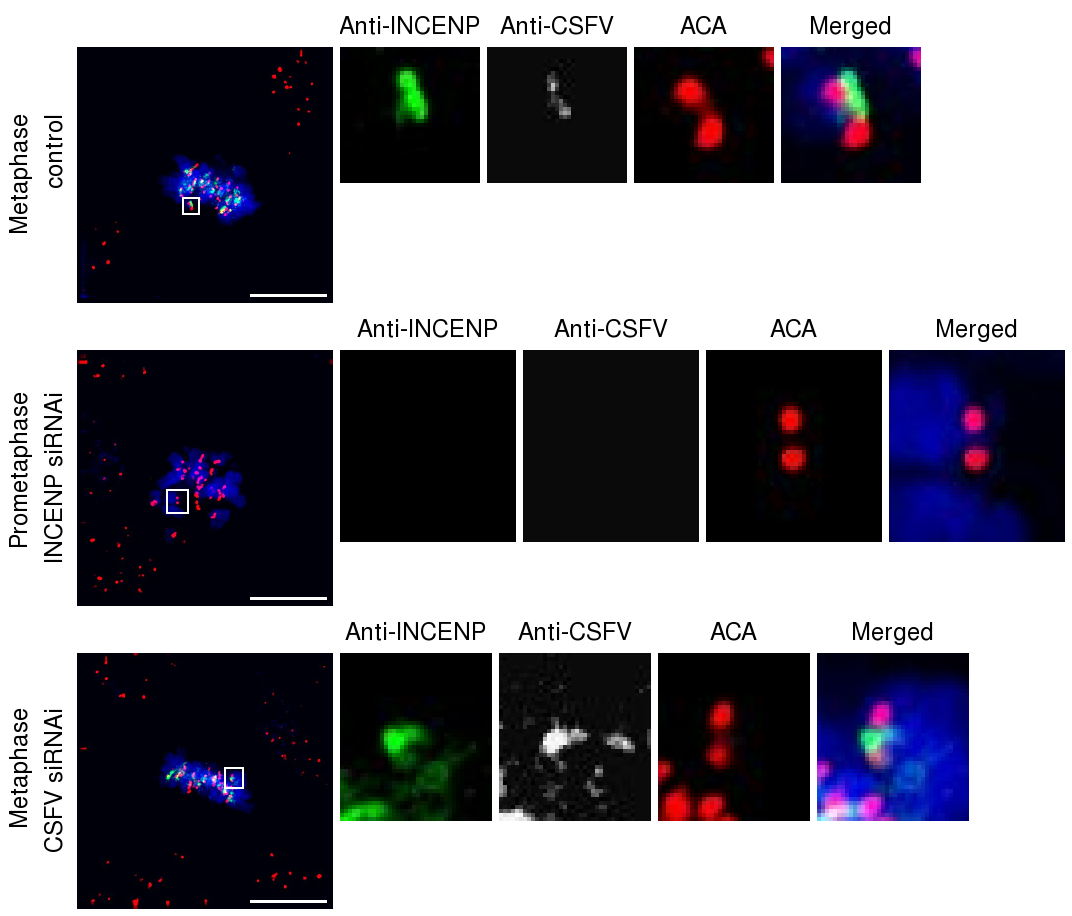
ROI figure of with split view showing a ROI zoom of 4.0 from the original pixels. NB. In this figure, the rendering settings are the same for all 3 images (as noted in the figure legend), allowing a direct comparison between them. ROI Movie FigureFor movies that have an ROI, this script will display the ROI region for every time point that the ROI exists. If the ROI for a particular time point spans several Z-sections, these will be projected. 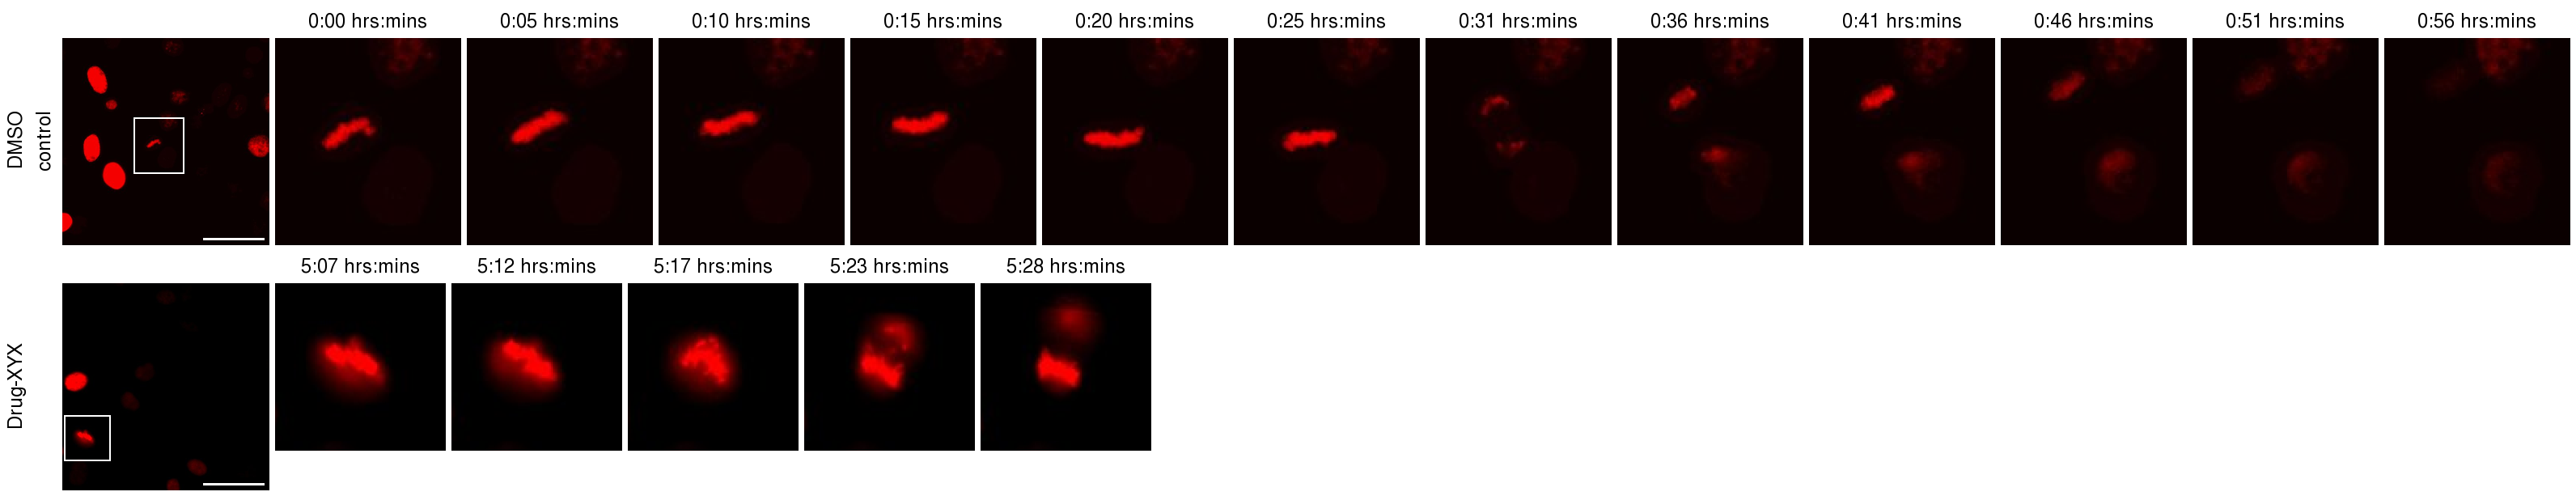
ROI figure from 2 movies. The number of frames is determined by the ROI for each image and images are labeled on the left with their Tags. Reference Example Figures (from outside sources)This is a list of the types of figures that are common in the Cell Biology literature (JCB archive), serving as a basis for scripts that could construct and export these figures from OMERO. All Figures should also export as text file (or save as annotation description) a figure legend that describes how the figure was made:
In general:
The following examples have been gathered from various sources to illustrate what the various figures should look like. Split-View figureSplit-view figures:
Examples:
Grid of Images
Movie
ROI-Zoom SplitviewChoose a rectangle ROI and display the contents as a zoom panel alongside it's parent. Options to zoom to same height as parent OR zoom by chosen factor (e.g. 4x). Options to display zoom:
ROI-Zoom movieKymograph
Document Actions |
 This section is documentation for an OLD release of our software!